MCP
New feature
MCP is a new feature. Please test it before deploying to production.
MCP (model context protocol) allows coding agents and harnesses to fetch real time PgDog metrics, logs and deployment information to help debug production incidents or configuration issues.
How it works
MCP is an HTTP protocol and most coding harnesses, e.g., Codex, Pi, Claude Code support it out of the box. It's disabled by default, so to enable MCP you need to set the following config in the control plane:
When enabled, the MCP server will be running on the same host and port as the control plane, under the /mcp path.
Authentication
Requests to the MCP server require Bearer token authentication. Unauthenticated requests will be rejected automatically. To configure authentication, you have two options:
- Hardcode a set of tokens in the configuration
- Enable Raft and add tokens via the web dashboard
Configuring tokens
A fixed set of Bearer tokens can be configured as follows:
If you're running our Helm chart, you can also load a comma-separated list of tokens from a Kubernetes Secret.
Create a Secret
Create the Secret in the same namespace as the control plane:
apiVersion: v1
kind: Secret
metadata:
  name: pgdog-mcp-tokens
type: Opaque
stringData:
  tokens: "token_one,token_two"
Once the Secret is created, you can reference it in the Helm chart values:
Dynamic tokens
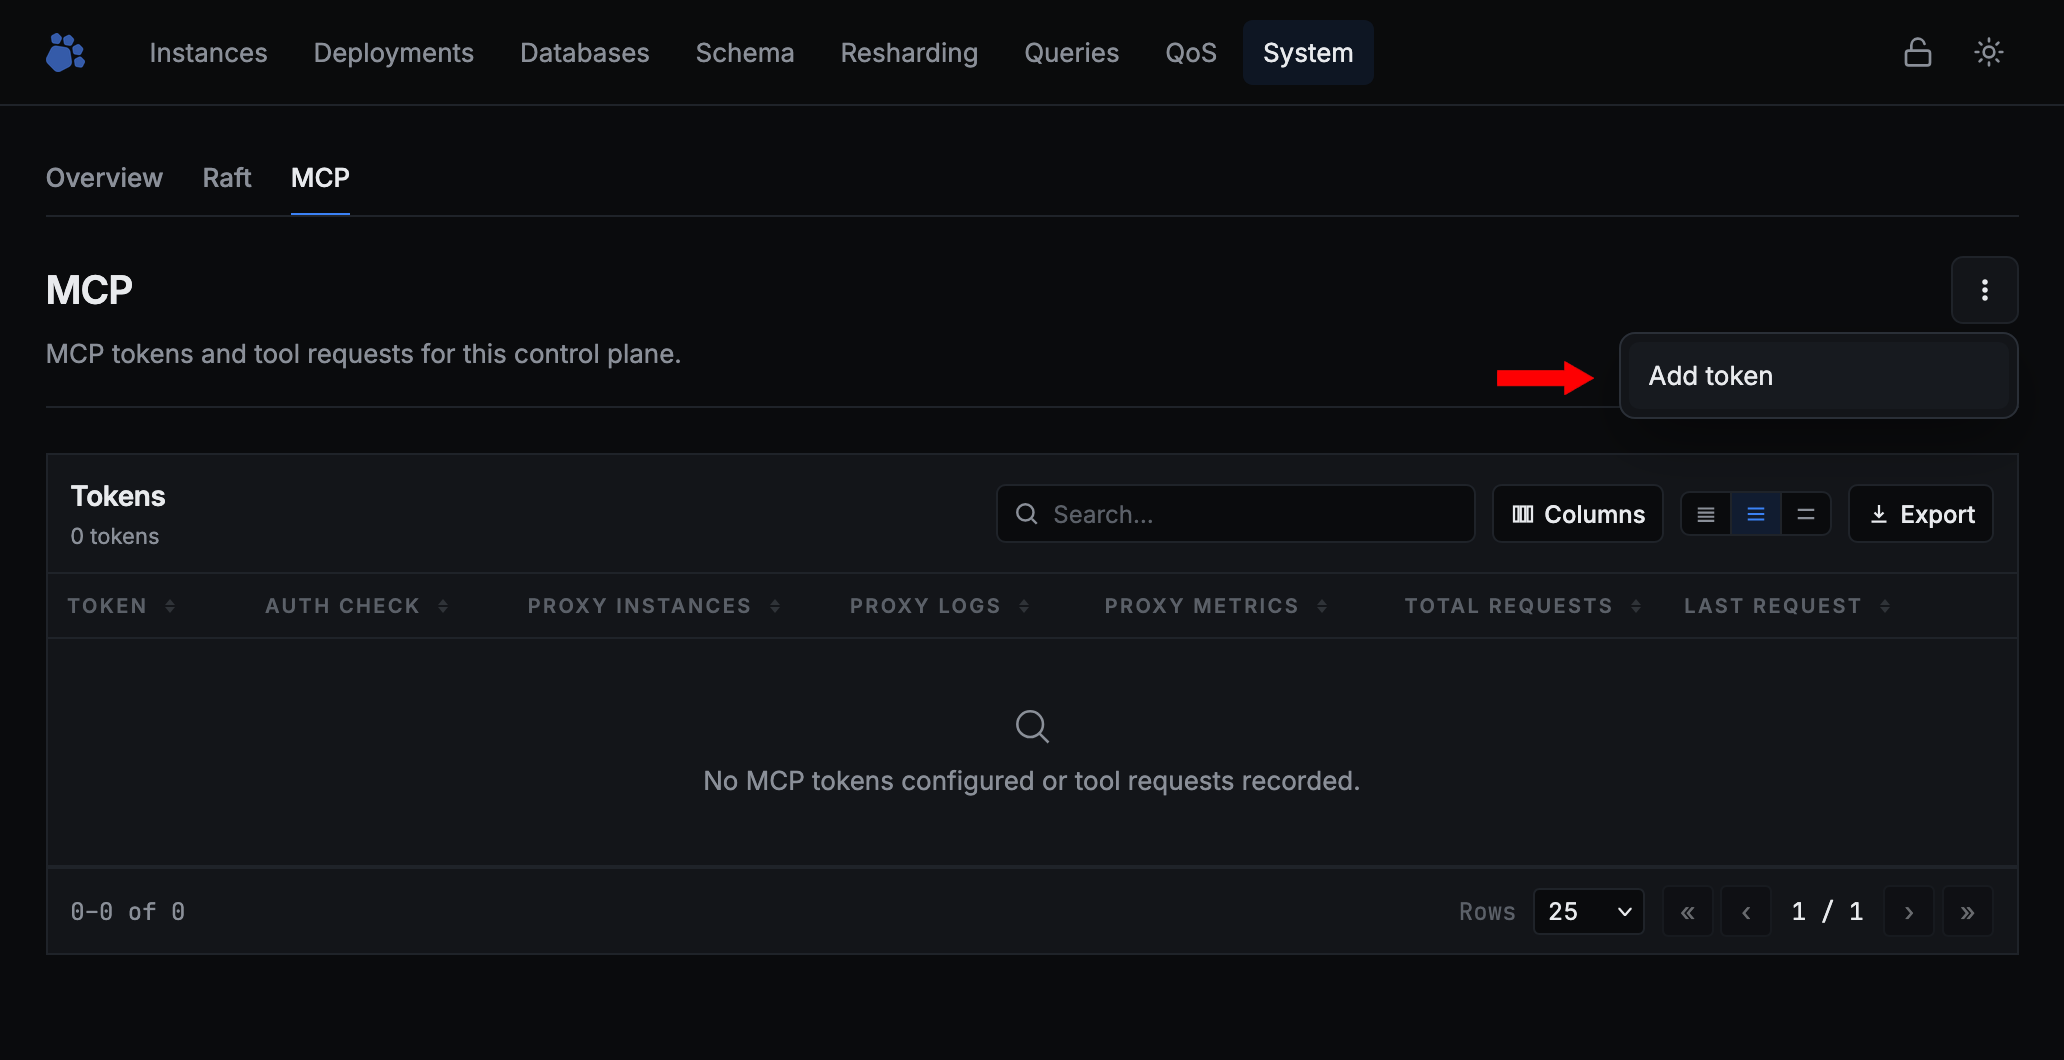
Managing tokens via configuration can be tedious, so the control plane also supports storing authorized tokens in its Raft log. Stored tokens are checked on each request to the MCP server, so tokens can be created and deleted at any time without configuration changes.
Configuring agents
Most agent harnesses support MCP out of the box, so configuring PgDog's MCP server should be pretty straightforward.
Codex
To add the MCP server to Codex, you can add it to either .codex/config.toml or ~/.codex/config.toml as follows:
[mcp_servers.pgdog]
url = "https://control.example.com/mcp"
http_headers = { Authorization = "Bearer <TOKEN>" }
Tools
Tools are read-only
All PgDog MCP tools are read-only and don't have any side effects. This makes them pretty safe to use with or without human supervision.
The MCP server comes with four tools:
| Tool | Description |
|---|---|
pgdog.proxy_instances |
Show an up-to-date list of PgDog instances currently running. |
pgdog.proxy_metrics |
Fetch real-time PgDog metrics. The tool allows you to filter by database/user, by Kube instance name, and by time window. |
pgdog.proxy_logs |
Fetch real-time logs from Kube containers running PgDog. |
pgdog.auth_check |
A no-op tool that allows you to verify if the harness has the correct Bearer token. |
An agent typically doesn't need special instructions to use these tools. For example, a common prompt to debug a production incident could be:
PgDog looks operational across the five reporting instances, as of 1:39 PM PST, November 10.

All five report running, with fresh telemetry and the same version: v0.1.64-v2026-11-03, commit 295f5ea. None reports maintenance mode or a pending reload.

| Instance | Clients | CPU | Memory |
|---|---:|---:|---:|
| Staging 87mh9 | 11 | 40.9% | 52.4 MiB |
| Staging fqs8t | 16 | 54.8% | 52.7 MiB |
| Sharded 0 | 7 | 10.1% | 11.6 MiB |
| Sharded 1 | 13 | 15.7% | 14.7 MiB |
| Resharding 0 | 0 | 0.2% | 7.1 MiB |

- No clients currently waiting for backend connections across reported pools.
- No warnings or errors in the recent log tails inspected.
- Staging CPU is the main watch item: observed peaks reached 97.7% and 92.5%. Pool queues peaked at six waiting clients, but are now clear.
- Resharding: no client traffic; logs show destination schema synchronization.