Alerts
Since the control plane has access to real-time PgDog metrics, it can detect outliers and trigger automatic alerts.
How it works
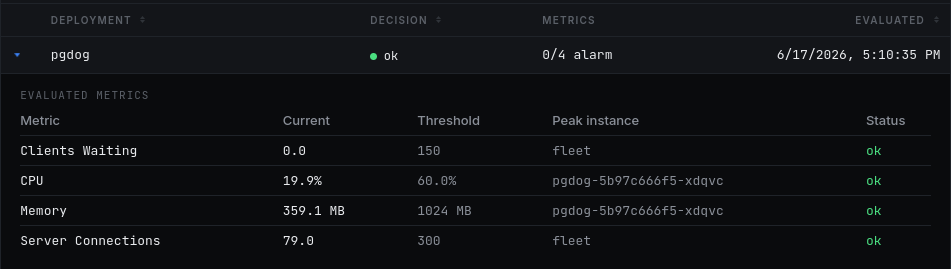
The control plane evaluates the metrics it receives from all PgDog instances on a continuous loop. When they exceed pre-configured thresholds, an incident is created using one of the configured integrations.
Integrations
The following incident management providers are supported:
| Provider | Description |
|---|---|
| incident.io | The control plane will create an incident with the highest available priority. |
Configuration
Alerts are disabled by default. To enable them, configure a provider's API key and set thresholds for each supported metric you would like to monitor:
control:
  config:
    alerts:
      evaluation_window_secs: 300
      thresholds:
        clients_waiting: 10
        cpu: 90.0
        memory: 2048
        server_connections: 100
      incident_io:
        api_key: inc_live_xxx
Parameters
Disabled by default
Thresholds have no defaults. If a threshold is not configured, its metric will not be monitored.
The following parameters are configurable via the Helm chart:
| Parameter | Description | Unit |
|---|---|---|
evaluation_window_secs |
The metrics evaluation window. Metrics are averaged over this period to produce an alert signal. | Seconds, e.g., 300 (5 minutes) |
clients_waiting |
Average number of clients waiting for a connection from a pool. | Clients, e.g., 10 |
cpu |
Average CPU utilization of each PgDog pod. | Percentage, e.g., 90.0 (90%) |
memory |
Average memory utilization of each PgDog pod. | MiB, e.g., 2048 (2048 MiB) |
server_connections |
Average number of open connections from PgDog to Postgres. | Connections, e.g., 100 |
Evaluation window
Longer evaluation windows reduce the chance of false positives in spiky workloads. Shorter windows will be evaluated quicker and will trigger faster notifications in case of an incident.