Running queries
PgDog EE provides a real-time view into queries currently executing on PostgreSQL connections. It is accessible in two places:
SHOW ACTIVE_QUERIESadmin command- Activity view in the dashboard
How it works
When a client sends a query to PgDog, it will first attempt to acquire a connection from the connection pool. Once acquired, it will register the query with the live query view. After the query finishes running, it's removed from the view.
Only queries that are currently executing through PgDog are visible in this view. If your application doesn't connect to PgDog, its queries won't appear here.
Admin database
You can see which queries are actually running on each instance by connecting to the admin database and running the SHOW ACTIVE_QUERIES command:
                         query                         | protocol | database | user  | running_time |
-------------------------------------------------------+----------+----------+-------+--------------+
 SELECT * FROM users WHERE id = $1                     | extended | pgdog    | pgdog |           15 |
 SELECT pg_sleep(50)                                   | simple   | pgdog    | pgdog |            5 |
 INSERT INTO users (id, email) VALUES ($1, $2)         | extended | pgdog    | pgdog |            1 |
The following information is available in the running queries view:
| Column | Description |
|---|---|
query |
The SQL statement currently executing on a PostgreSQL connection. |
protocol |
What version of the query protocol is used. simple protocol injects parameters into text, while extended is used by prepared statements. |
database |
The name of the connection pool database. |
user |
The name of the user executing the query. |
running_time |
For how long (in ms) has the query been running. |
Dashboard
If you're running multiple instances of PgDog, active queries from all instances are aggregated and sent to the Dashboard application. They are then made available in the Activity tab, in real-time, with query plans automatically attached for slow queries.
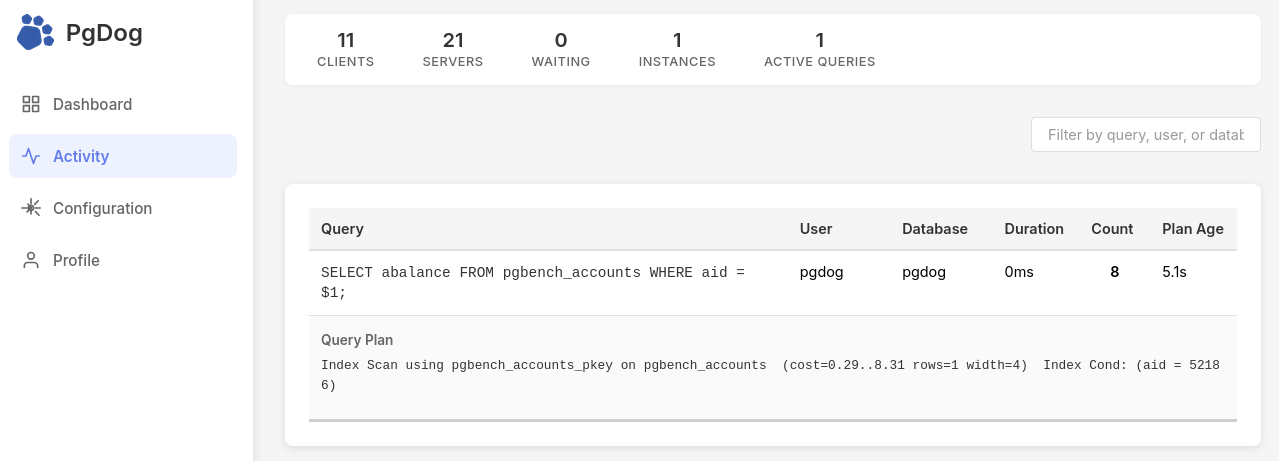 Real-time view into running queries.